Import this chart into Investor/RT
Click the download button. Then drag and drop the downloaded file into Investor/RT to view the chart.
This chart was uploaded by Investor/RT 15.1.10 showing symbol: @ES#.
Click the download button. Then drag and drop the downloaded file into Investor/RT to view the chart.
This chart was uploaded by Investor/RT 15.1.10 showing symbol: @ES#.
Comments
How often does price open
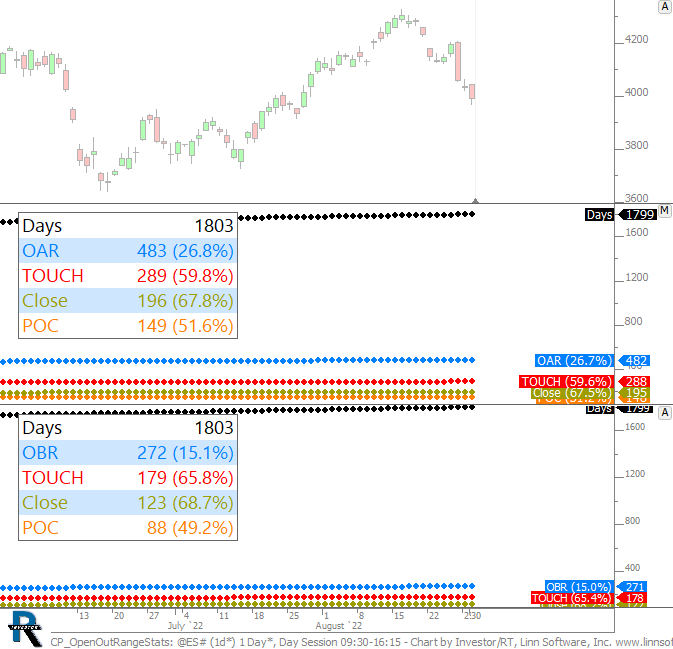
How often does price open above/below prev day session range. Of those days, how often does it TOUCH range. And of those days, how often does it continue to Close and POC or prev day?
CLOSE
When you refer to close. Do you mean closing OUT of range or BACK in range?
Return to Prev Close
And of those days, how often does it continue to Close and POC or prev day?
So that refers to ...opening outside of range, but at some point in the session, moving to touch the prev close. (it doesn't have to close there or below there...just return to prev close at some point in the day).
CLOSE
for example. On the OBR. it says close (68.7%) does this mean 68.7% of the time we still close below range?
Same with poc(49.2%) does this mean POC is below of range?
Thanks Chad, this looks like a useful study for me if im sure this is correct
Returning to Prev Close
"On the OBR. it says close (68.7%) does this mean 68.7% of the time we still close below range?"
that means, 68.7% of the time it returns into prev range, it proceeds on to the prev close. That should be pretty clear from the raw numbers next to the percentages.
CLOSE
for example. On the OBR. it says close (68.7%) does this mean 68.7% of the time we still close below range?
Same with poc(49.2%) does this mean POC is below of range?
Thanks Chad, this looks like a useful study for me if im sure this is correct