Import this chart into Investor/RT
Click the download button. Then drag and drop the downloaded file into Investor/RT to view the chart.
Statistic on days that opened outside of previous day range. If opening above range... How often did price return to the VAH? How often did price return to POC? If opening below range... How often did price return to VAL? How often did price return to POC?
Comments
Chart Details
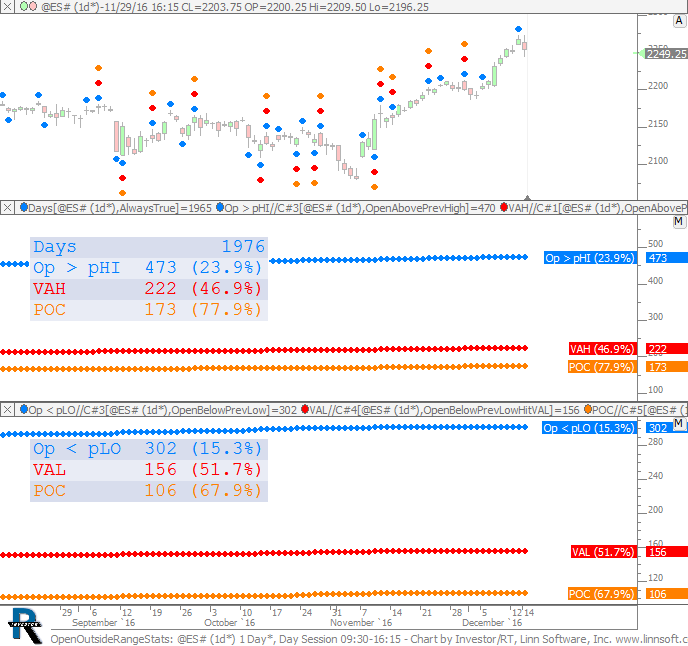
In top pane, the dots above represent days when opening above previous high. Blue dots signal opening above previous high. Red dots signal opening above previous high and returning to previous VAH. Orange dots signal opening above previous high and returning to previous POC. The dots below represent days when opening below previous low. Blue dots signal opening below previous low. Red dots signal opening below previous low and returning to previous VAH. Orange dots signal opening below previous low and returning to previous POC.
The middle pane provides cumulative stastics when opening above previous high, showing number of days tested, number and percent of those days we opened above the previous high, number and percent of those days we moved back to the VAH, and number and percent of those days that we moved back to POC.
The middle pane provides cumulative stastics when opening below previous low, number and percent of all days we opened below the previous low, number and percent of those days we moved back to the VAL, and number and percent of those days that we moved back to POC.
So reading the chart above, we tested 1976 days, and 473 of those days (23.9%) we opened above the previous day session high. Of those days, we returned down to the previous VAH 222 times (46.9% of days we opened above previous high), and of those days, 173 times (77.9%) we returned back to previous POC.