Import this chart into Investor/RT
Click the download button. Then drag and drop the downloaded file into Investor/RT to view the chart.
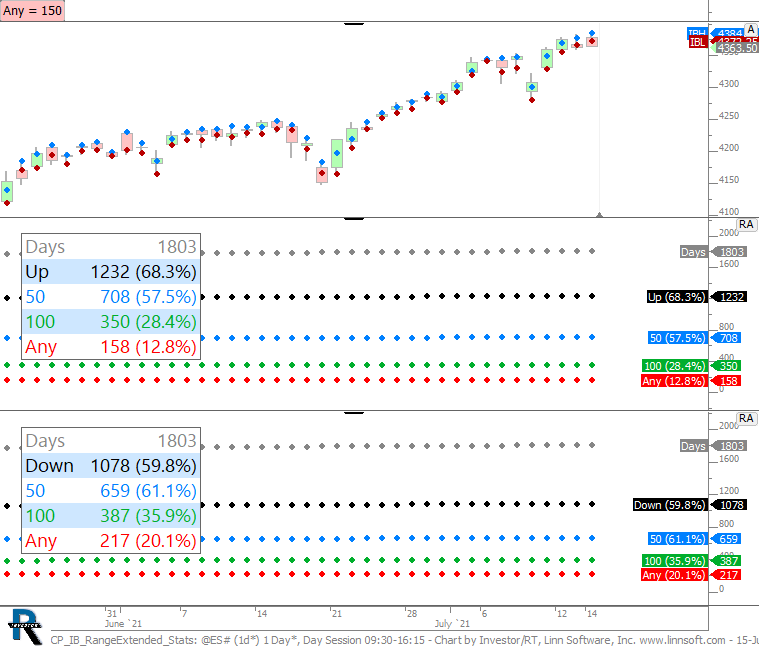
Percent of days IB range was extended up or down, and how often when extended up or down, it extends 50% and 100% in the same direction. Use the Any button at top to enter a custom percentage. This chart was uploaded by Investor/RT 14.2.7 showing symbol: @ES#.