VolumeScope

VolumeScope® (RTX)

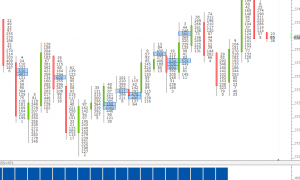
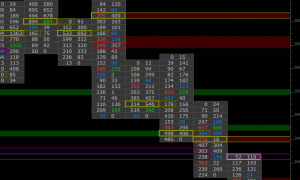
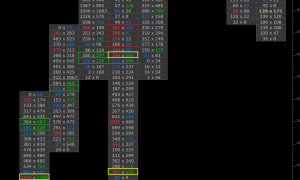
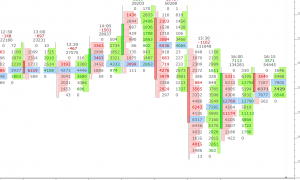
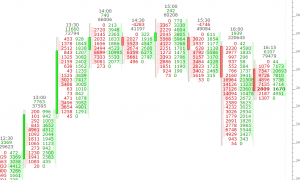
VolumeScope is the best in class footprint charting available, allowing the user to view per bar market order flow under a microscope, closely inspecting the volume at price data with great flexibility. The VolumeScope indicator has three primary components: Background, Text, and Candle. Each is optional and each has a variety of data and presention settings. Volume is broken down into Ask-Traded Volume (Buying) and Bid-Traded Volume (Selling) at each price. VolumeScope builds upon this information with profiling, coloring, and scaling options based upon relative volume, delta, imbalance, and much more.

Footprint Charting Tools

Investor/RT has extensive FootPrint charting and analysis tools, having been a pioneer in the development of Footprint charting almost 20 years ago. For a short history of Linn Software's role regarding the Footprint, read more here. The central component of Investor/RT's Footprint Toolbox is the VolumeScope charting extension.

VolumeScope is the best in class Footprint(r) charting available, allowing the user to view per bar market order flow under a microscope, closely inspecting the volume at price data with great flexibility. The VolumeScope indicator has three primary components: Background, Text, and Candle. Each is optional and each has a variety of data and presention settings. Volume is broken down into Ask-Traded Volume (Buying) and Bid-Traded Volume (Selling) at each price. VolumeScope builds upon this information with profiling, coloring, and scaling options based upon relative volume, delta, imbalance, and much more.
Footprint  is a  registered trademark of Linn Software, Inc. All Rights Reserved

VolumeScopeStats (RTX)

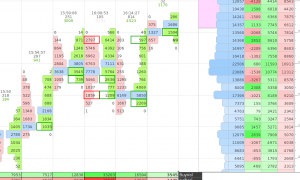
This VolumeScopeStats (VSS) RTX Indicator is designed to compute volume-at-price statistics that are sensitive to both time of day and periodicity of the chart. This allows users to compute and identify values of significant volume or delta at price throughout the day with statistics based on the volume-at-price of the same time of day over previous session. 

Introducing Investor/RT Version 13.5

Introducing Investor/RT Version 13.5

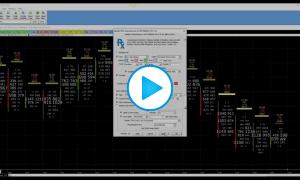
This webinar from November 9, 2018, offers an overview of some exciting new enhancements to some of our most popular Indicators such as VolumeScope®, ZigZag, Paint Indicator, Multiple Price Highlighter, Bar Statistics, Chart Trading Dom and more.

VolumeScope™ Improvements in Investor/RT 13.5

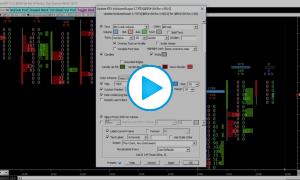
This video highlights enhancements made to the VolumeScope™ RTX Indicator in Investor/RT 13.5. These include new title options Volume Brick and Delta Percent, Button Indicator support, current price highlighting options, variable font size, inverse profile styles, smaller text size options, show zero volume text options, and much more.

VolumeScopeExtendKeyPrices (@ES#)

Chart uses Multiple Price Highlighter to extend key prices while naked. Prices extended include VPOC (gold), Buy Imbalance (green), Sell Imbalance (red) and Unfinished Business (pink). This chart was uploaded by Investor/RT 13.2.2 showing symbol: @ES#.

VolumeScope® Announcement

VolumeScope® Announcement

Linn Software is a leading innovator of market data profiling and volume analysis charting tools for professional traders, creating indicators and real-time market data displays to help traders to identify profit making opportunities and to make more timely trading decisions. Some of our most advanced work in this area was developing the Footprint™ feature, previously available on a charting platform developed by Linn Software, powered by Investor/RT but marketed and distributed by MarketDelta.

Pages