Import this chart into Investor/RT
Click the download button. Then drag and drop the downloaded file into Investor/RT to view the chart.
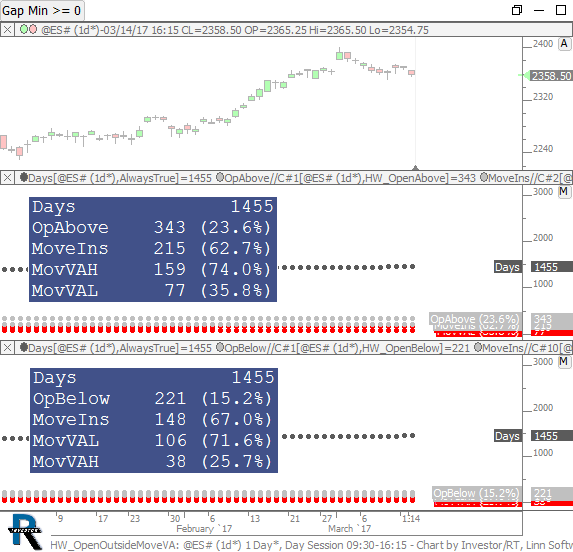
Open Outside Range - Move Inside Range - Move to opposite VAH/VAL. This chart was uploaded by Investor/RT 12.7.1 showing symbol: @ES#.
Comments
Middle pane shows that out of
Middle pane shows that out of 2905 days, 622 days (21.4%) we opened above the previous days range. Of those 622 days, 409 (65.8%) we moved back inside of range. Of those 409 days we opened above and moved back in, 303 (74.1%) we moved back to VAH and 127 times (31.1%) we moved back to VAL.
In lower pane, 438 of the 2905 days (15.1%) we opened below range. 311 of the 438 days we move back inside range (71%). 239 of those 311 days we moved back to VAL (76.8%) and 89 times we moved back to VAH (28.6%).
How to Apply in Asian Market Trading With US Session Profiles
Hello,
I was trying to redo this study today but under slightly different parameters and was having a difficult time trying to figure out how to implement it .
I am currently trading the Asian markets from between 17:00-2:00 AM Central time so what I would like to do is test when the Asian market opens above the US session VAH, below VAL, and Inside the VA. I would then like to look at cases, where we re-enter the US session VA from above our below and test how often we travel across the full VA when this condition is met. Any help on how to tackle this is appreciated.
EDIT: I realized after I wrote this that the study above looks at opening location with respect to previous range and not VA, So just want to clarify that I am not concernced with where we open compared to previous session but where we open compare to US session VA.