Import this chart into Investor/RT
Click the download button. Then drag and drop the downloaded file into Investor/RT to view the chart.
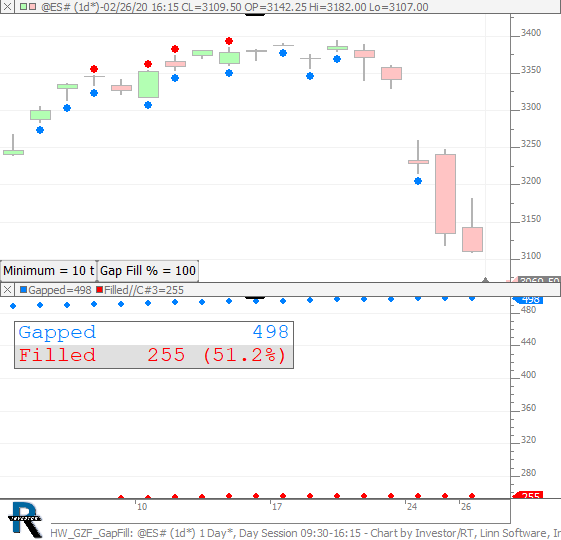
Homework - Gap Zone Fill Stats. Use buttons to provide the minimum gap required to be considered. Use 2nd button to provide the percentage of that gap that must be filled. Gap Zone refers to gap from previous high/low to open. This chart was uploaded by Investor/RT 14.1.12 showing symbol: @ES#.
Comments
t
Another useful study. What does T mean? Does it mean ticks? if so. Does that mean a gap is atleast 2.5 points?
t for Ticks
Yes, the t is for ticks. So 10t is 2.5 points on ES.